Shipped 2026
Poultry farm operations
Overview
A 10,000-bird egg farm, run on WhatsApp and spreadsheets.
The farm is a commercial egg operation with three pens and more than 30 staff. Every day, it moves eggs, feed, fuel and money. Every one of those figures travelled as a text message and ended up in a spreadsheet.
I replaced it with one operations system.
I designed and built it end to end: research, data model, backend, frontend and deployment. Since October 2026, it has held every daily record the farm produces.
The problem
The records existed. The structure didn't.
Daily figures arrived as messages from the pens, the store and the wider farm, and were keyed into a set of spreadsheets that had grown without a common structure. Each sheet served its own purpose, but together they offered no single view of the operation. Reading across them took effort, and reconciling them took days.
No checks at any step.
Errors entered silently and stayed hidden.
Nothing validated the data on the way in. A mistyped figure, a missing report or a store count that didn't reconcile went undetected until month-end, when compiling a single report took around two days.
The most valuable data was never captured.
Eggs are sold in five grades, each at its own price. Sales were recorded by grade, but collection was recorded as a single total. The farm could see 40 crates of large eggs leave the store, but could never confirm that 40 crates had come in. Any shortfall disappeared into the total.
The result: decisions made on figures no one could verify.
Stock on hand, the cost of feeding each pen, whether the store balanced: the farm had no dependable answer to any of them. That matters most for feed, which is the largest single cost in egg production, typically 60–70% of the total.
My approach
I started with the operation, not the software.
Before designing anything, I mapped how the farm actually works. I traced how eggs move from pen to store to customer, how feed is ordered, delivered and consumed, how staff are paid, and what the owner needs to see at the end of each month.
Mapping the flow exposed what was missing.
Egg grades were one gap. Feed type was another: pens reported how many bags they used, but not which feed, so per-pen feed cost was impossible to calculate. I worked with the farm to add both to daily reporting, giving the system complete and consistent inputs.
Where should the store balance come from?
This mirrors the spreadsheets and inherits their weakness: one wrong entry and the balance drifts from reality, with no trail explaining why.
Each stock movement is recorded once, at the moment it happens: collections, sales, deliveries, daily feed use, and fuel purchases and usage. The balance is calculated from that ledger, so it can be reproduced for any date. When a physical count disagrees, an adjustment resolves it, and every adjustment requires a reason.
Tap or hover a movement to trace it.
How should feedings be recorded?
This fits today's routine but hard-codes it. Adding a third daily feeding would mean changing the software.
Bags are logged once a day, as a total for each feed. Feeding times are logged on their own, as many as the day needs. The routine can change without the software changing.
What should happen when an entry looks wrong?
Clean in theory, but farm data rarely arrives in order, and feed is sometimes used before its delivery is logged. Hard blocks would stall data entry and push staff back to workarounds.
Records always save, and anomalies surface as warnings. Missing pen logs, unreconciled stock and over-delivered orders are flagged on the dashboard and summarised in the monthly report.
The solution
Every egg is traced by grade, from pen to customer.
Pens log collection by grade, in crates and pieces. When an egg's grade changes after collection, for example when it cracks in transit, a conversion records the change with a reason. Totals stay intact, and every egg is accounted for.
Feed cost is visible at the pen level.
A moving-average cost for each feed, based on actual purchase prices, is applied to every bag consumed. The result is a daily feed cost for every pen, the farm's largest expense made measurable for the first time.
Designed for high-volume entry.
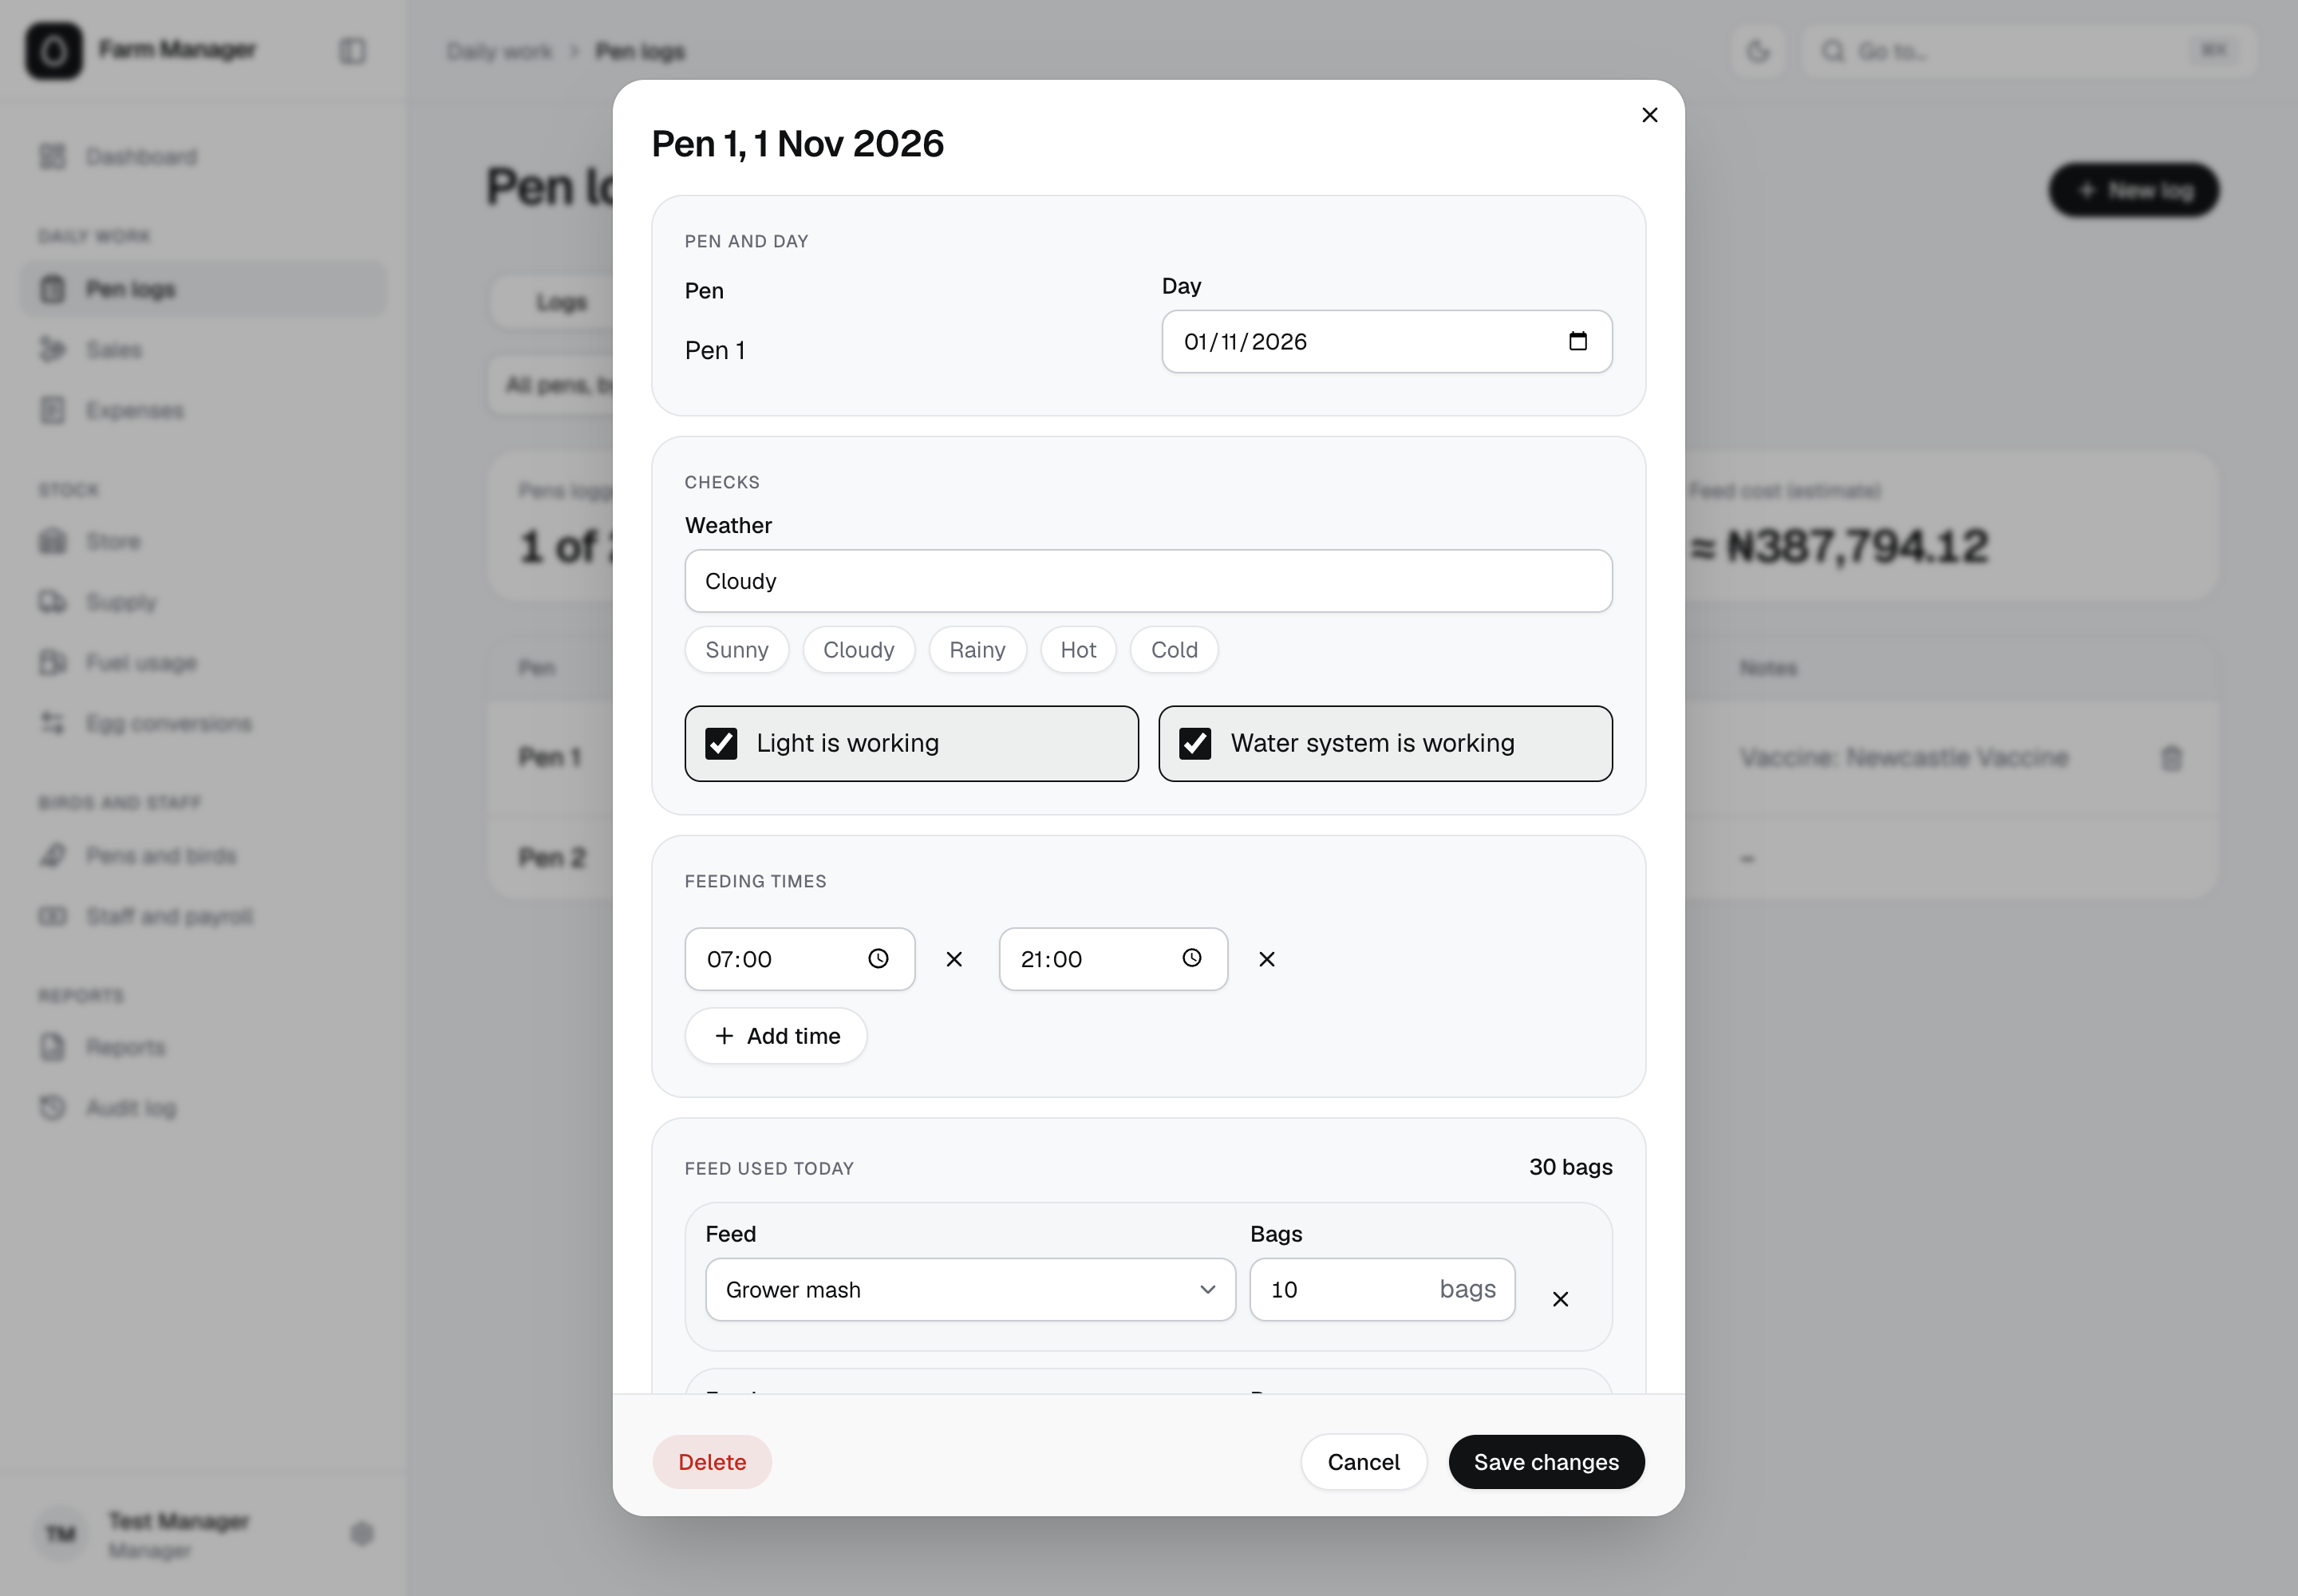
Dozens of reports go in every day, so the interface is built to stay out of the way.
- Quiet by default. A monochrome palette and a single typeface, with nothing on screen that doesn't serve the task.
- Colour carries meaning. Amber signals a warning, red a loss, green completion. Exceptions stand out at a glance.
- The farm's vocabulary. Eggs are counted in crates and pieces, and payroll prints in the farm's existing salary-sheet format.
- Absence is visible. A pen without a log still appears, marked "Not logged".
- Laptop and phone. Tables reflow into stacked rows on mobile, and forms open as bottom sheets.
Under the hood
For technical readers.
Business logic lives on the server. The client only renders.
- Ledger-based inventory. Balances are never stored. They are computed from stock movements, so they are reproducible for any date.
- Exact arithmetic. Money and quantities use decimals throughout, never floating point. Eggs are stored as units and displayed as crates of 30.
- Integrity at the database layer. Constraints such as "one log per pen per day" are enforced by PostgreSQL, independent of the UI.
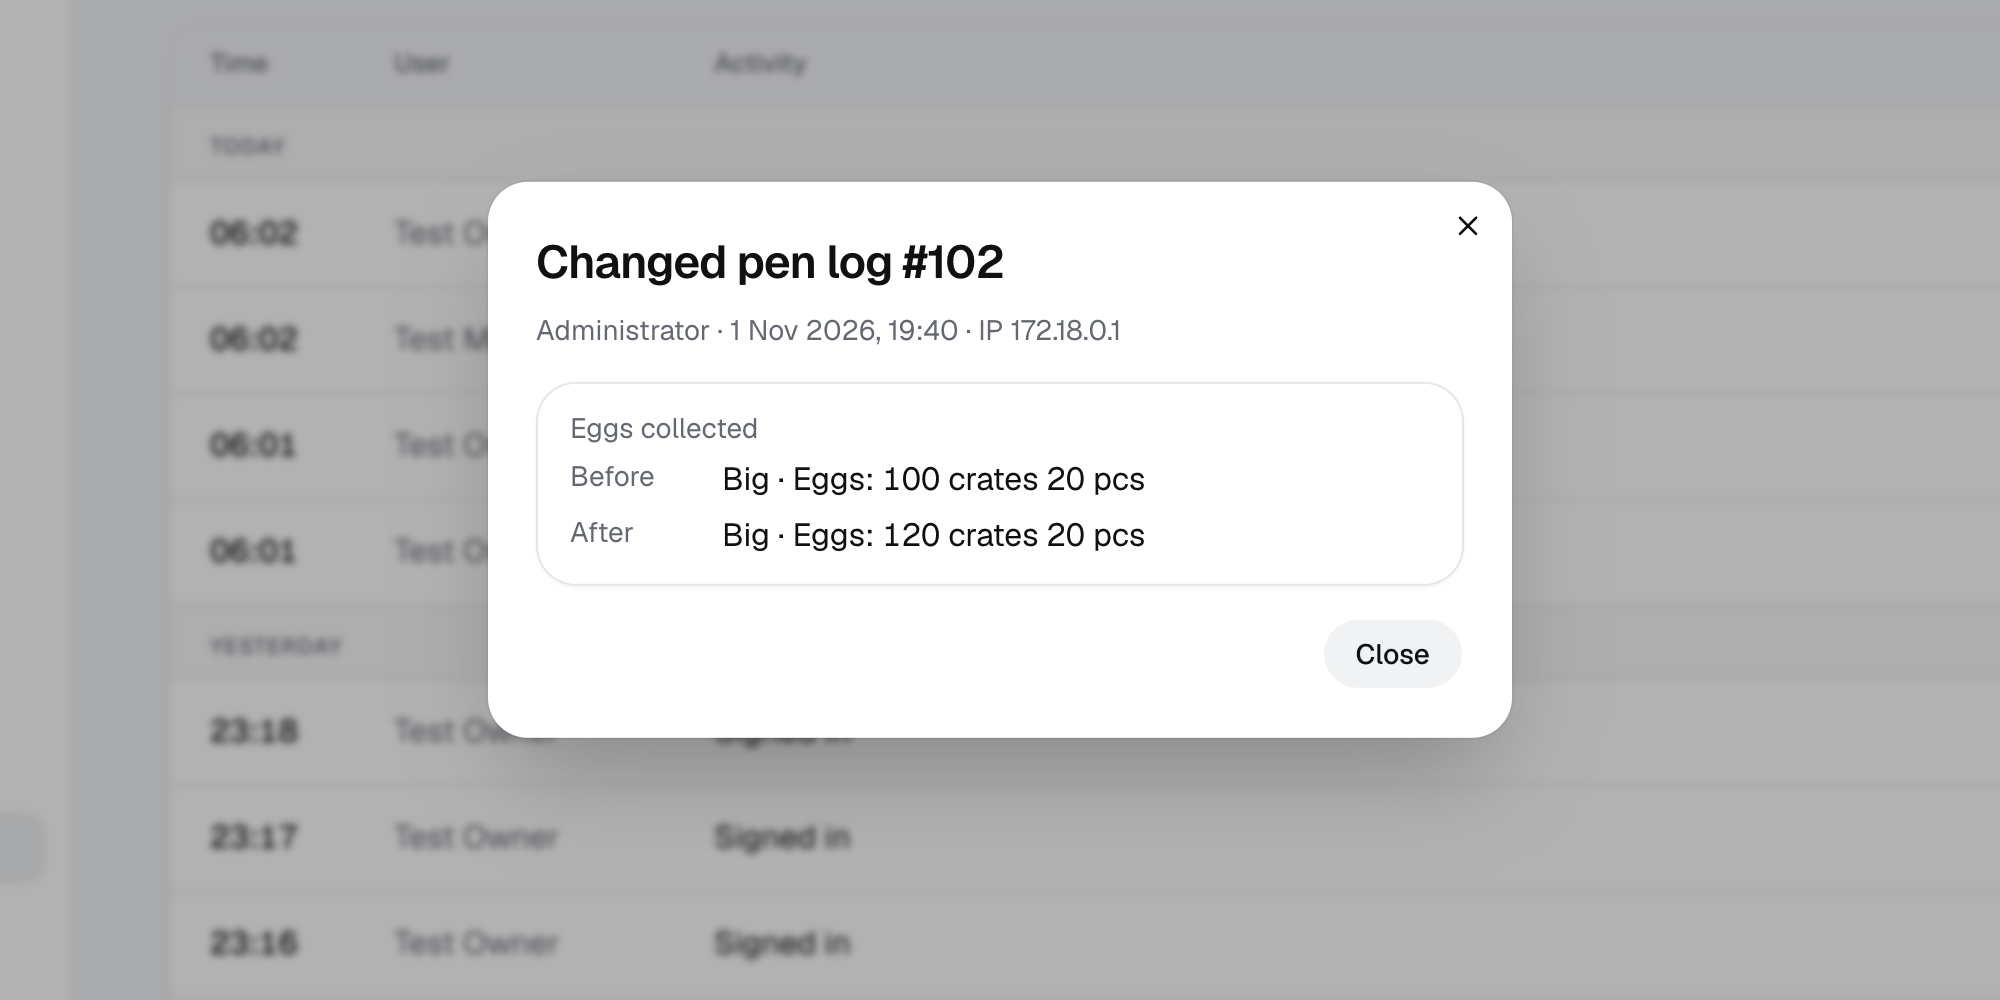
- Full traceability. Soft deletes, plus an audit log capturing the before and after state of every change.
- Server-enforced roles. The owner's account is read-only at the API level, not just hidden in the interface.
- Resilient and tested. Report summaries are cached in Redis and degrade gracefully without it. More than 200 automated tests cover the business rules.
Outcome
The farm now runs on figures it can trust.
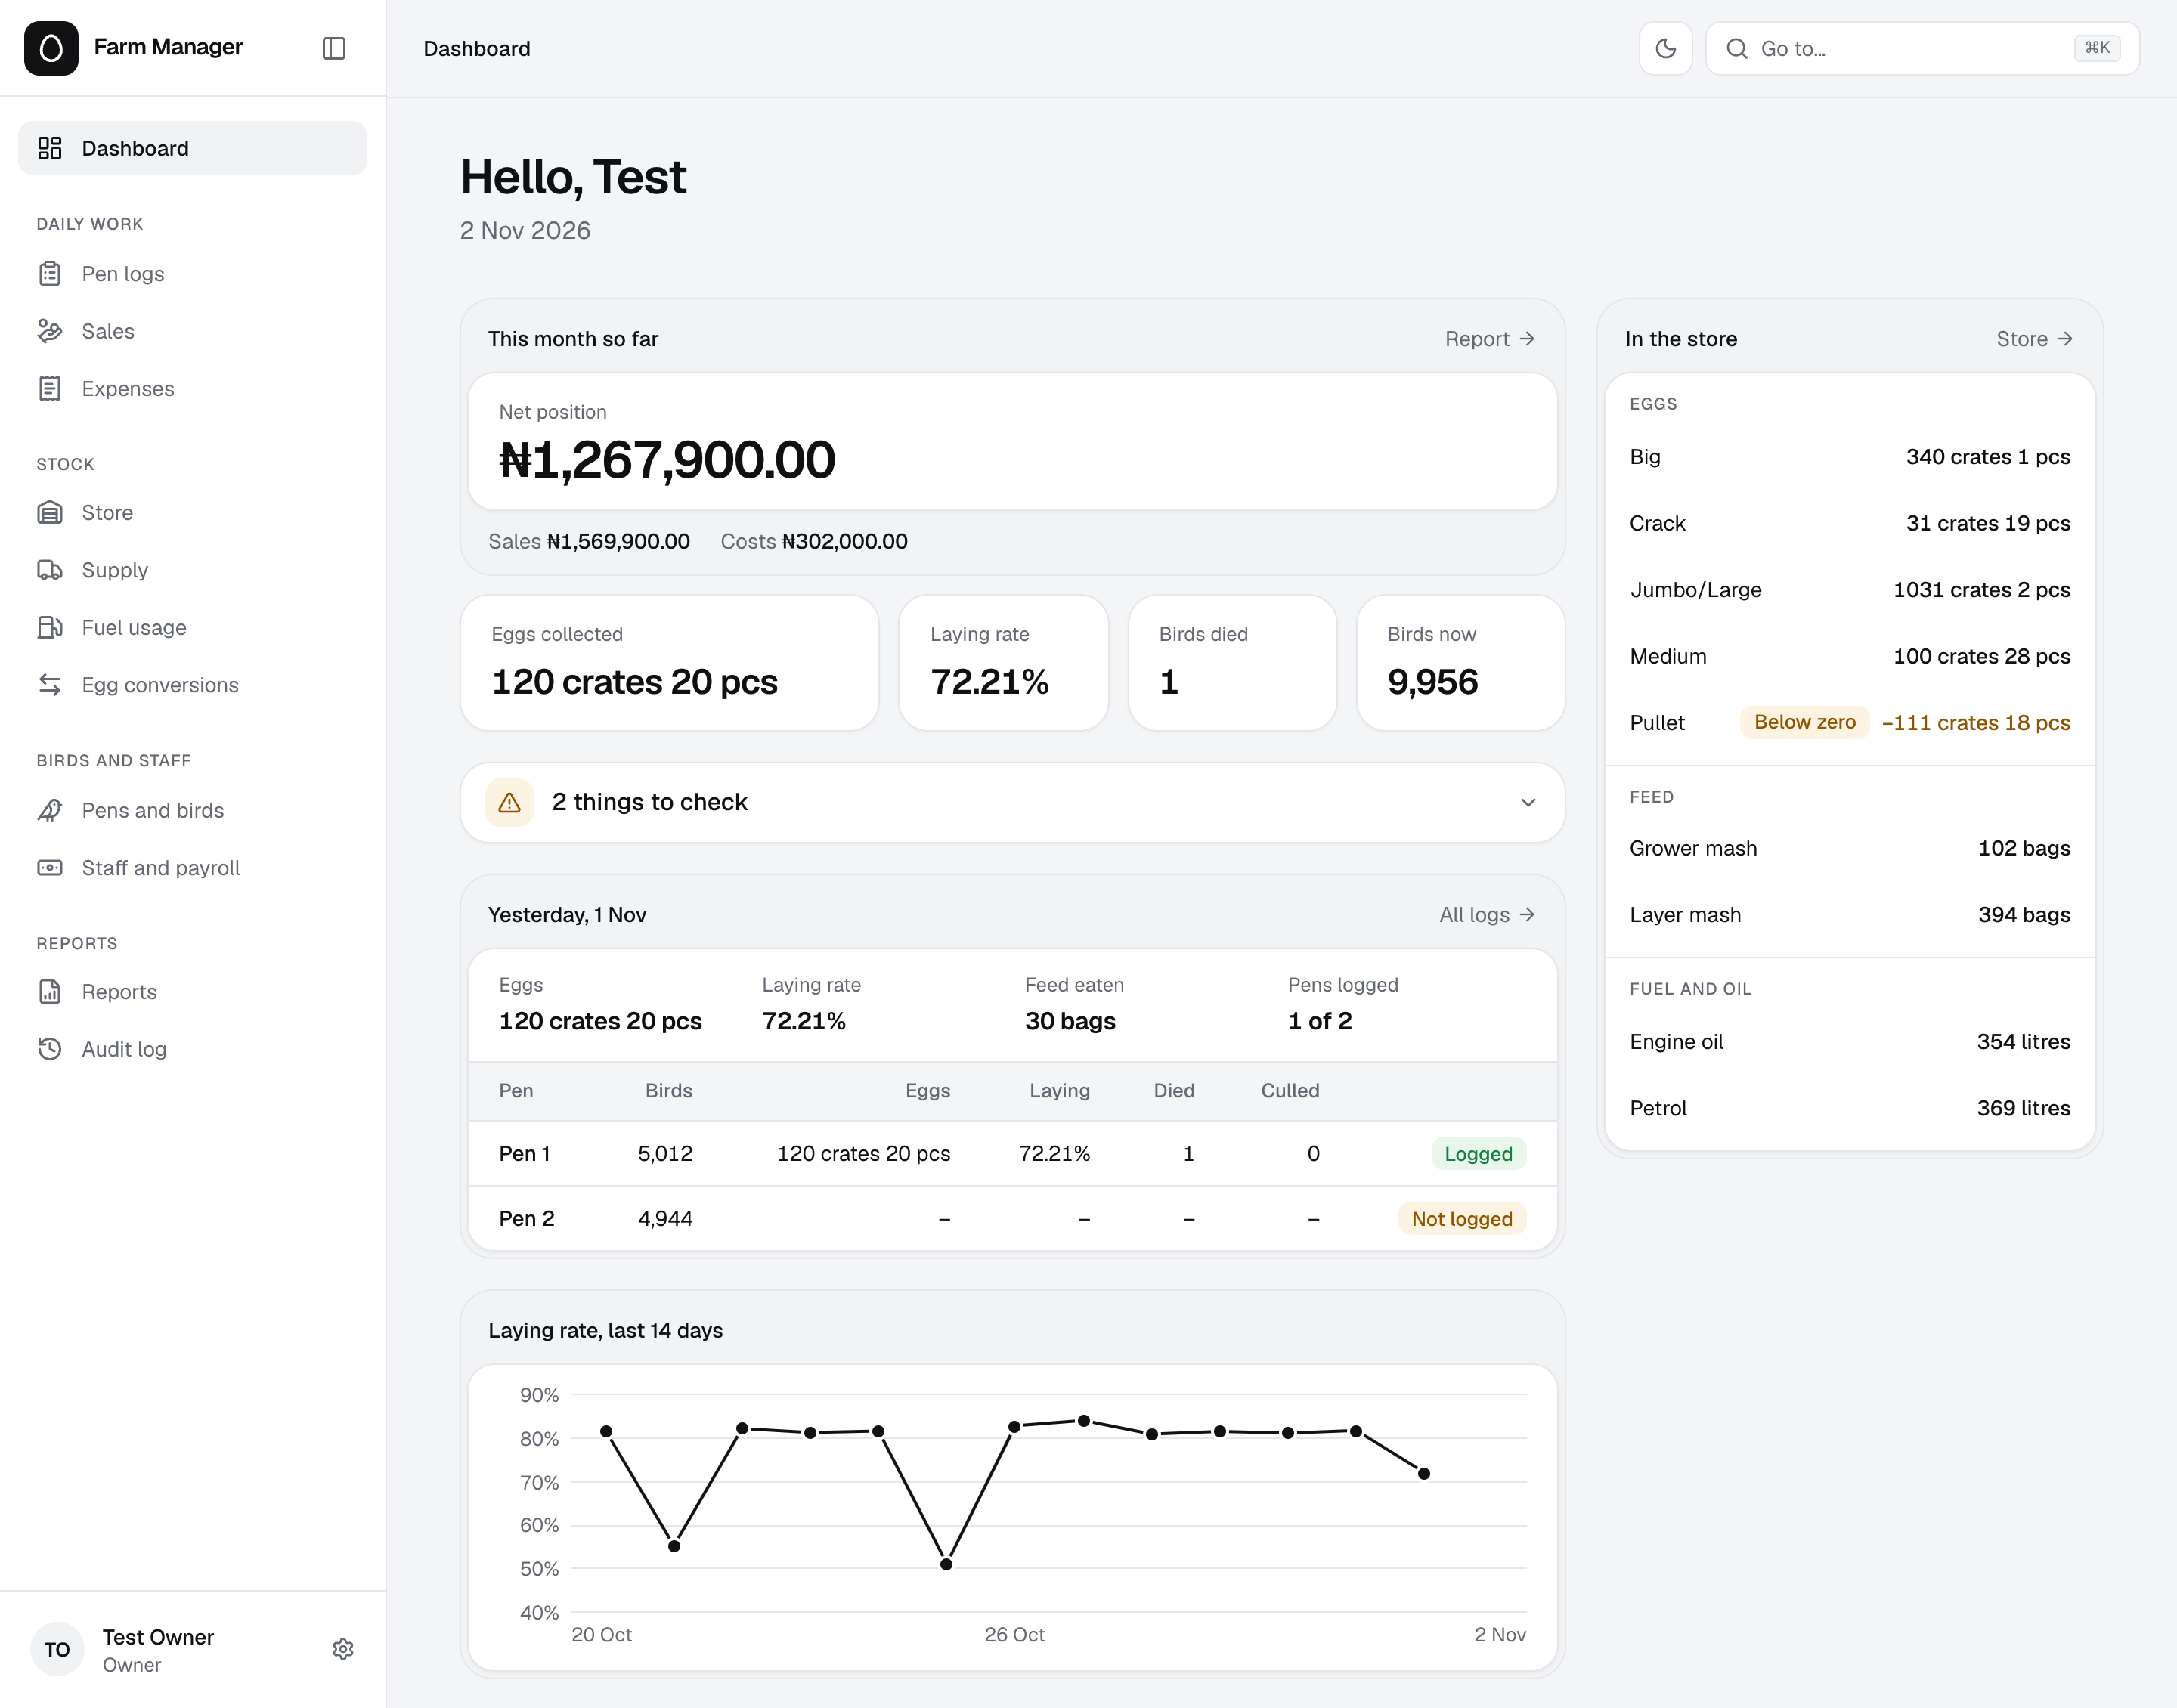
- Stock by grade, on demand. In its first week, the system recorded 3,382 crates and 22 pieces collected, fully broken down by grade. Before, that figure could only be estimated.
- Month-end reporting: from two days to instant. Reports are generated on demand from the daily records.
- One view of the operation. Stock levels, unreconciled items, missing logs and month-to-date performance all sit on a single dashboard.
Reflection
The most valuable work happened before any code. Mapping the operation revealed data that had never been captured. No amount of automation would have fixed that.
Real operations are messy, and good systems accommodate that. Late data, human error and changing routines are normal. Warnings instead of blocks, a full audit trail and flexible records were designed around that reality, not against it.
Next: moving data entry to the source. Letting staff log reports directly would remove the retyping step, and the errors that come with it.